
Blogs
Comparing Dow Jones to S&P 500 & NASDAQ
Aman Anand
Comparing Dow Jones with Other Indices
The Dow Jones Industrial Average is a cornerstone of the stock market. It's one of the oldest indices, dating back to 1896.
But how does it compare to other major indices like the S&P 500 and NASDAQ? Each index has unique features and serves different purposes for investors. This guide compares Dow Jones with Other Indices to clarify the differences.
Understanding these differences is crucial for making informed investment decisions.
This article will explore the key distinctions between these indices. We'll delve into their composition, weighting methods, and market coverage.
By the end, you'll have a clearer picture of which index aligns best with your investment goals.
Summary
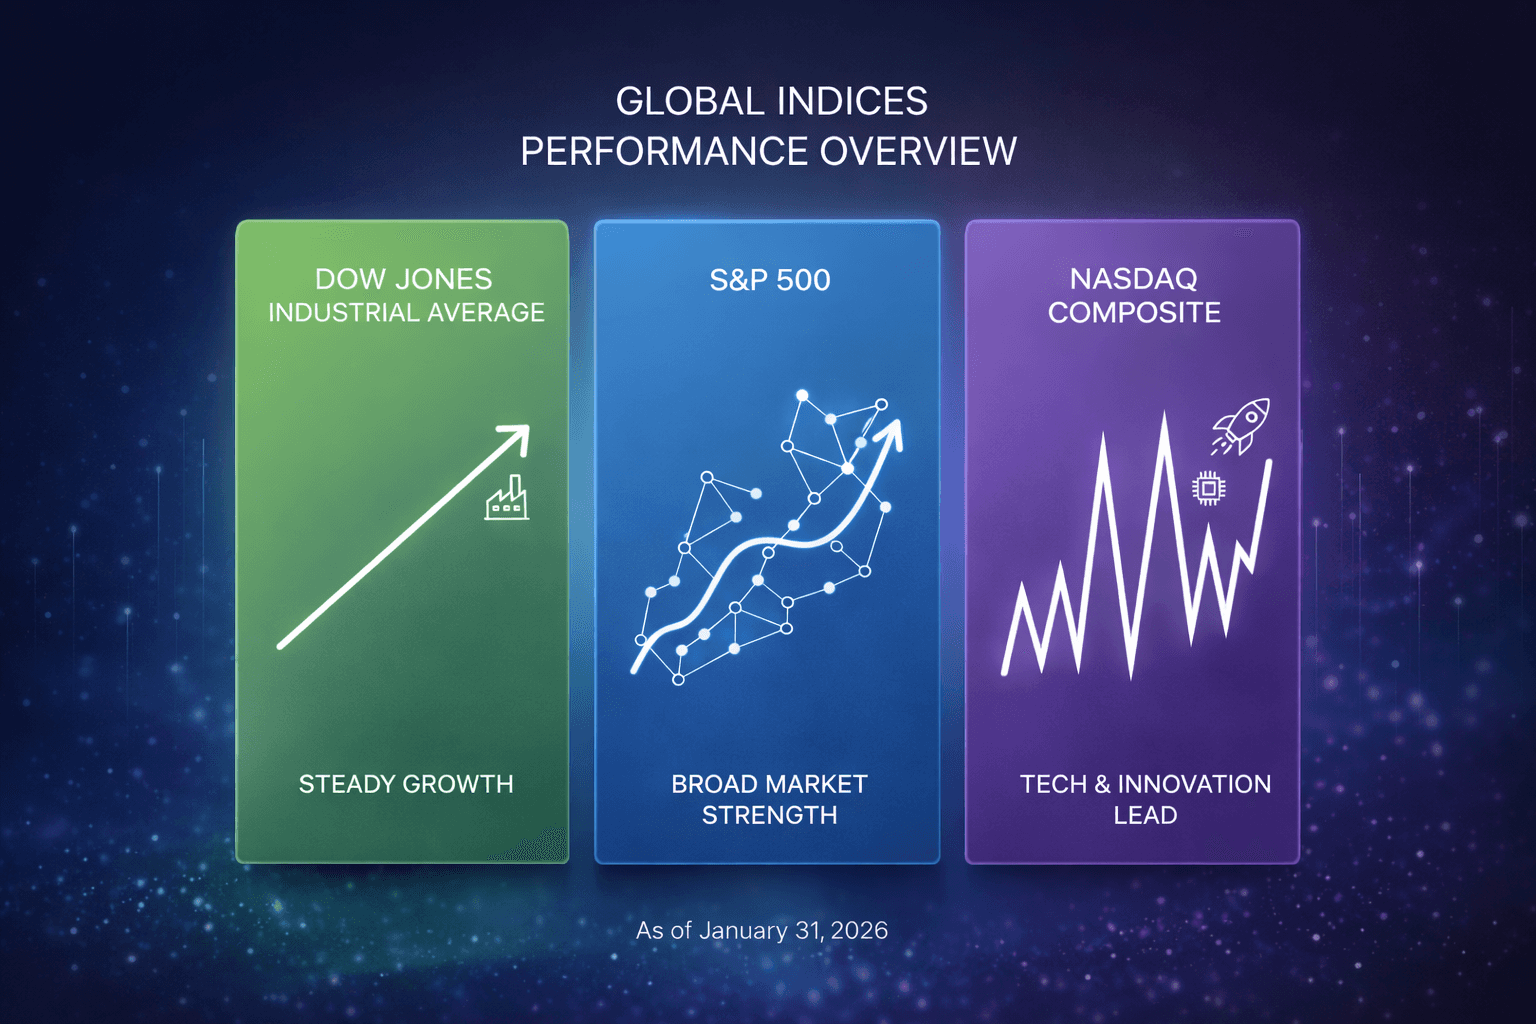
The Dow Jones (30 blue-chip stocks, price-weighted) contrasts with the broader S&P 500 (500 companies, market-cap weighted) and tech-heavy NASDAQ (3,000+ companies, market-cap weighted) in composition, weighting, and sector emphasis. These differences shape performance and volatility — Dow can be skewed by high-priced constituents, the S&P offers balanced market breadth, and NASDAQ tends to be more volatile due to its tech exposure. The article compares their methodologies, market coverage, and global context to help investors select the index that best fits their goals and risk tolerance.
Understanding the Dow Jones Industrial Average
The Dow Jones Industrial Average, often called the Dow, is iconic in the financial world. It comprises 30 major U.S. companies, spanning a range of industries.
These companies are large, established names, often referred to as blue-chip stocks. They are leaders in sectors like finance, healthcare, and technology.
A unique feature of the Dow is its price-weighted method. This means that stocks with higher prices impact the index more significantly. Unlike the S&P 500 or NASDAQ, this weighting can lead to skewed results.
Key aspects of the DJIA include:
Represents 30 large companies
Uses price-weighted method
Iconic and historical significance
The DJIA acts as a barometer for U.S. market health. Its ups and downs draw considerable attention from investors and the media alike.
Key Differences Between Dow Jones, S&P 500, and NASDAQ
The Dow Jones, S&P 500, and NASDAQ each serve distinct roles. They differ in composition, weighting, and sector representation.
The S&P 500 includes 500 companies, making it broader than the Dow's 30. It reflects a wider spectrum of the U.S. economy.
NASDAQ, with over 3,000 companies, is notable for its tech focus. It houses many high-growth, tech-oriented firms, contributing to its volatility.
Distinct characteristics of these indices include:
Dow Jones: 30 companies, price-weighted
S&P 500: 500 companies, market-cap weighted
NASDAQ: Over 3,000 companies, tech-heavy
Price weighting in the Dow gives higher-priced stocks more influence. This can lead to disproportionate reactions to changes in a few stocks.
Conversely, the S&P 500 and NASDAQ use market-cap weighting. This approach offers a balanced view, considering company size and overall market influence.
The sector focus also varies. The Dow favors industry leaders, the S&P spreads across key sectors, and NASDAQ leans heavily on technology.
These differences help investors choose the most relevant index. They can select based on their focus, whether it be economic breadth or tech innovation.
Weighting Methods: Price-Weighted vs. Market Cap-Weighted Indices
Understanding the weighting methods of stock indices is crucial. The Dow Jones is unique due to its price-weighted system. Here, the stock price determines the weight.
This method means stocks with higher prices have more influence. So, a change in a single high-priced stock can significantly impact the index.
Conversely, the S&P 500 and NASDAQ employ a market-cap-weighted approach. Here, a company's market capitalization dictates its influence on the index.
Key differences between these methods include:
Price-Weighted (Dow Jones): Relies on stock price
Market Cap-Weighted (S&P 500, NASDAQ): Factors in company size
Market-cap weighting offers a balanced perspective of market movements. This method accounts for both size and scale, reflecting the broader economy.
Market Coverage and Sector Representation
The scope and sectors covered by a stock index are essential to investors. The Dow Jones comprises just 30 companies, highlighting established giants.
In contrast, the S&P 500 presents a broader market perspective. It includes 500 companies spanning diverse industries, thus offering more sector diversity.
NASDAQ, recognized for its tech focus, lists over 3,000 companies. This results in higher representation in technology and growth industries.
A quick sector breakdown includes:
Dow Jones: Focus on blue-chip companies
S&P 500: Wide sector representation
NASDAQ: Heavy on tech and innovation
Such differences in coverage can affect market analysis. They give investors varied insights into specific sectors' performance.
Performance, Volatility, and After-Hours Trading
Performance metrics are crucial in evaluating indices. The Dow Jones is often viewed as stable due to its blue-chip company focus. Despite this, it can still reflect significant economic changes.
In contrast, the S&P 500 offers a more balanced snapshot. Its wide array of sectors showcases an accurate depiction of the U.S. market's overall health.
On the flip side, NASDAQ is known for its sharp fluctuations. Its high-tech concentration can lead to increased volatility. This is especially evident during tech industry shifts.
Understanding how these indices trade after hours is also important. On a down stock market day, differences in sector mix can amplify moves and dispersion among these indices. The Dow index after hours can predict morning trends. Investors observe:
Price swings in Dow after hours
NASDAQ's rapid movement
S&P 500's reliable performance indicators
Each index offers unique insights for assessing future market movements.
Global Indices: How Dow Jones Compares Internationally
The Dow Jones is a prominent index not just in the U.S., but globally. Its long history gives it a unique standing among investors worldwide. However, it's essential to compare it with international indices for a broader understanding.
Indices like the FTSE 100, Nikkei 225, and DAX 30 provide insights into their respective markets. These indices reflect economic health similar to the Dow but vary in composition and focus. Each of these indices has different sector and regional emphases.
Investors can gain diverse global perspectives by comparing:
Dow Jones with FTSE 100
Dow Jones with Nikkei 225
Dow Jones with DAX 30
Global index comparison helps investors understand economic shifts and market opportunities across continents.
Which Index Should Investors Watch?
Choosing the right index to track depends on individual goals. Each index offers unique insights based on its composition and focus. The decision should align with the investor's strategy and interests.
The Dow Jones is ideal for tracking large, established U.S. companies. On the other hand, the S&P 500 provides a broader view with more diverse sector representation. NASDAQ is suitable for those interested in tech and growth-oriented stocks.
Key considerations for investors include:
Investment focus (e.g., tech vs. blue-chip)
Desired market coverage
Volatility tolerance
Ultimately, diversifying by monitoring multiple indices can offer a comprehensive market view. This approach can enhance decision-making by capturing wider economic trends.
Conclusion: Choosing the Right Index for Your Needs
Selecting the appropriate index hinges on your investment priorities and risk tolerance. Each index caters to different market segments and investor needs. Understanding the unique attributes of each can guide you in making informed decisions.
The Dow Jones offers a reliable measure of major industrial corporations' performance. If you prioritize stability and established companies, this index could be your choice. However, it's essential to note its limited scope.
For those seeking broad market exposure, the S&P 500 might be a better fit. Meanwhile, NASDAQ attracts investors looking for innovation and growth. Balancing your portfolio with insights from these indices can lead to more robust investment strategies.