
Blogs
How to manage trading portfolios for optimal results
Aman Anand
TL;DR:
Effective portfolio management relies on diversification, risk control, and systematic rules.
Using proper tools and data ensures disciplined decision-making and minimizes emotional bias.
Ongoing verification, backtesting, and disciplined rebalancing enhance long-term trading success.
Many traders watch hard-earned gains disappear not because their market analysis is wrong, but because their portfolio management is inconsistent. Without clear rules for position sizing, diversification, and risk control, even well-researched trades can erode a portfolio over time. This guide delivers actionable, data-driven strategies to help you manage your portfolio with discipline and precision. From foundational principles to rebalancing techniques and performance verification, each section builds on the last to give you a repeatable framework for stronger, more consistent trading results.
Table of Contents
Key Takeaways
Point | Details |
|---|---|
Diversification matters | Holding 15-20 securities across sectors and regions keeps risk manageable. |
Risk control is essential | Limit each trade to 1-2% of your portfolio and keep total risk exposure in check. |
Systematic rules beat gut-feeling | Using objective, repeatable rules prevents emotional mistakes and improves outcomes. |
Review and adapt | Regularly track, review, and refine your portfolio process for continuous improvement. |
Understand the essentials of portfolio management
Successful portfolio management starts with a few non-negotiable principles: diversification, risk control, and systematic rules. These are not optional extras. They are the structural foundation that separates traders who survive long-term from those who blow up on a single bad streak.
Diversification means spreading exposure across multiple holdings, sectors, and regions. Reducing unsystematic risk to under 5% is achievable with 15 to 20 holdings spread across at least five sectors. Adding geographic diversity across three or more regions further insulates your portfolio from localized shocks. Concentration in one sector or region is one of the most common and avoidable sources of outsized loss.
Position sizing defines how much capital you allocate to each trade. A basic rule: never risk more than 1 to 2% of your total portfolio on a single position. This keeps any one loss from doing serious damage to your overall equity.
Systematic rules remove the emotional decision-making that costs traders money. A rule-based trading strategy defines entry, exit, and sizing criteria in advance, so you are not improvising under pressure.
Here is a quick comparison of the two primary management styles:
Feature | Buy-and-hold | Active management |
|---|---|---|
Rebalancing frequency | Infrequent | Regular or conditional |
Emotional risk | Lower | Higher |
Cost | Lower | Higher |
Adaptability | Low | High |
Best for | Long-term investors | Active traders |
Key principles to keep in mind:
Hold 15 to 20 securities across five or more sectors
Limit single-trade risk to 1 to 2% of portfolio value
Define rules for entry, exit, and position sizing before trading
Review portfolio heat (total open risk) daily
“Discipline in portfolio construction is not a constraint on performance. It is the engine of it.”
Pro Tip: Start with a written trading plan that includes your maximum position size, sector limits, and daily heat cap. Reviewing this before each session keeps your decisions anchored in rules, not emotions.
Set up your portfolio: Tools, requirements, and preparation
After learning the essentials of portfolio management, gather the right tools and resources before taking action. A well-configured setup reduces friction and makes it easier to follow your rules consistently.
Your brokerage account should support real-time data, conditional orders, and portfolio-level risk reporting. These features are not luxuries. They are practical necessities for anyone managing more than a handful of positions. Many modern platforms also offer built-in analytics dashboards that display exposure by sector, correlation heatmaps, and daily P&L breakdowns.
Data sources matter too. You need access to price feeds, volume data, and volatility metrics like average true range (ATR) and implied volatility (IV). These inputs feed directly into your position sizing and risk calculations.
For tracking trading performance, dedicated portfolio analytics tools offer more granular insight than most brokerage dashboards. Options range from spreadsheet-based trackers to platforms that integrate directly with your broker via API. The goal is to see your portfolio’s full risk picture at a glance.
When designing trading algorithms or rule sets, systematic rules over discretion help eliminate cognitive biases and support data-driven adjustments through daily tracking of P&L, correlations, and heat.
Here is a setup checklist to get started efficiently:
Open a brokerage account with real-time data and conditional order support
Identify your primary data sources for price, volume, and volatility
Choose a portfolio tracking tool that shows sector exposure and correlations
Define your risk parameters: max position size, daily loss limit, and heat cap
Document your rules in a written trading plan before placing any trades
Tool type | Purpose | Example use case |
|---|---|---|
Brokerage platform | Order execution and basic analytics | Real-time P&L tracking |
Data feed | Price, volume, volatility inputs | ATR-based position sizing |
Portfolio tracker | Exposure, correlation, heat monitoring | Sector concentration alerts |
Backtesting software | Strategy validation | Testing rebalancing rules |
Pro Tip: Run a paper trading session with your full setup before committing real capital. This stress-tests your tools and workflow without financial risk.
Apply risk controls and position sizing techniques
With tools in hand, the next step is risk control, arguably the most decisive factor in long-term trading success. Knowing how to size positions correctly and monitor total portfolio risk keeps you in the game through inevitable losing streaks.

Calculating position size follows a straightforward formula. Divide your maximum dollar risk per trade (1 to 2% of portfolio) by the distance between your entry price and stop-loss. For example, on a $50,000 portfolio with a 1% risk limit ($500) and a $2 stop distance, your position size is 250 shares. This keeps every trade within a defined loss boundary.
Portfolio heat, meaning total risk across all open positions, should be capped at 30 to 50% of portfolio value. Monitoring heat daily prevents the cumulative risk from creeping beyond acceptable levels, especially during volatile market conditions.
For advanced sizing, the Kelly Criterion offers a mathematically optimal approach. The formula is: f* = (edge / odds), where edge is your expected return and odds represent the payoff ratio. In practice, fractional Kelly sizing reduces drawdowns significantly compared to full Kelly, making it more suitable for real-world trading where edge estimates are imprecise.
For setting algorithmic risk parameters, these formulas translate directly into coded rules that execute without hesitation. Pairing them with data-driven trading models adds another layer of objectivity to your sizing decisions.
Common risk control mistakes to avoid:
Ignoring portfolio heat and letting total risk accumulate unchecked
Sizing up after a winning streak without recalculating risk parameters
Using full Kelly without accounting for estimation error in your edge
Failing to adjust position size when volatility increases
Steps to implement risk controls:
Set a hard cap of 1 to 2% risk per trade based on your portfolio size
Calculate position size using entry price minus stop-loss distance
Monitor total portfolio heat daily and reduce it when approaching your cap
Apply fractional Kelly (typically 25 to 50% of full Kelly) for sizing optimization
Review and recalibrate risk parameters after any significant drawdown
Pro Tip: If your portfolio heat regularly approaches its cap, that is a signal to reduce the number of open positions, not to raise the cap.
Rebalancing and adaptive management strategies
Risk controls guard each trade, but the full portfolio needs maintenance through smart rebalancing and adaptation. Without periodic review, drift can quietly shift your risk profile far from its intended structure.
Fixed-interval rebalancing means adjusting allocations on a set schedule, such as monthly or quarterly. This approach is simple and consistent, but it can generate unnecessary transaction costs. Rebalancing costs the industry approximately $16 billion annually, and frequent rebalancing can reduce returns by systematically selling winning positions too early.
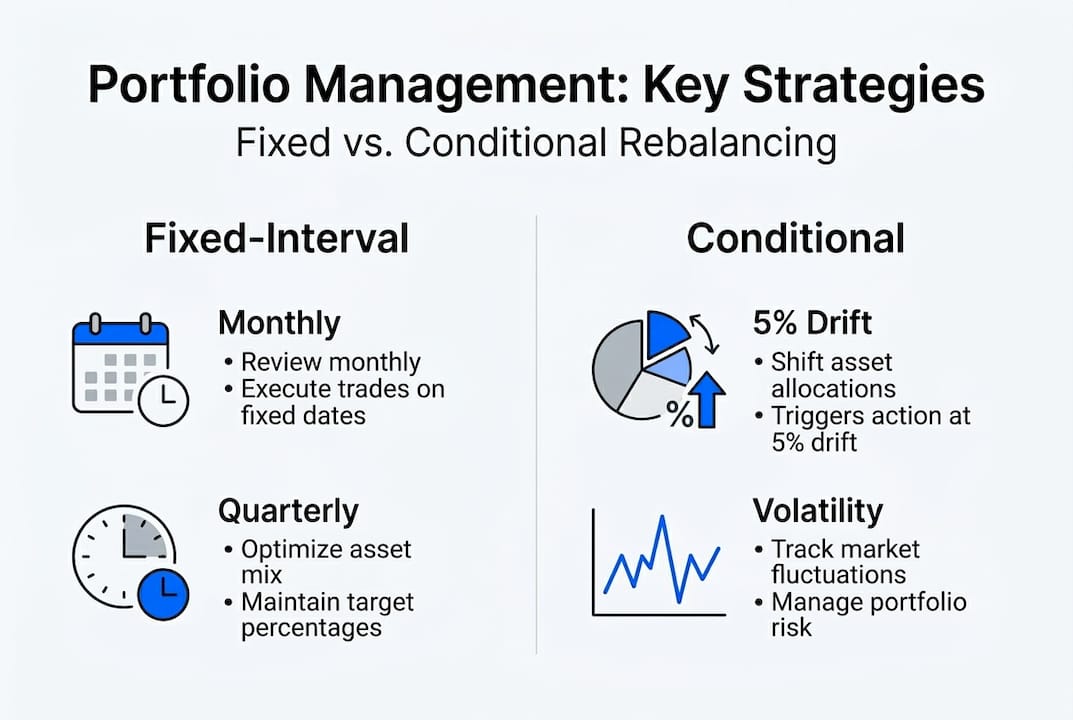
Conditional rebalancing triggers adjustments only when allocations drift beyond a defined threshold, such as 5% from target. This reduces unnecessary trades while still maintaining risk discipline. Time-varying asset allocation (TVAA) takes it further, using forecasts to shift allocations dynamically based on expected market conditions.
Strategy | Trigger | Cost | Best for |
|---|---|---|---|
Fixed-interval | Calendar schedule | Moderate | Systematic traders |
Conditional | Drift threshold | Lower | Cost-conscious traders |
TVAA | Forecast-based | Variable | Adaptive managers |
Buy-and-hold | Rarely | Lowest | Long-term investors |
Edge cases require special attention. High sector concentration amplifies losses when a single industry corrects sharply. Illiquid assets may require proxy instruments for rebalancing when direct sales are not practical. During volatility spikes, reducing portfolio heat quickly takes priority over maintaining target allocations.
Key rebalancing considerations:
Set drift thresholds (e.g., 5% from target) to trigger conditional rebalancing
Account for transaction costs and tax implications before rebalancing
Use effective backtesting strategies to evaluate how different rebalancing rules perform historically
Monitor market analysis strategies to inform adaptive allocation decisions
Verify and fine-tune your portfolio management process
Management does not end with execution. Ongoing verification and improvement complete the cycle and ensure your rules remain effective as market conditions evolve.
Daily tracking should cover three core metrics: P&L, inter-position correlations, and portfolio heat. Correlations are especially important because positions that appear diversified can move together during market stress, amplifying losses unexpectedly. Catching this early allows you to reduce exposure before it becomes a problem.
Periodic reviews, conducted weekly or monthly, give you the distance needed to evaluate whether your strategy is performing as expected. This is where you compare actual results against your backtested assumptions and identify gaps.
Review type | Frequency | Key metrics |
|---|---|---|
Daily check | Every trading day | P&L, heat, correlations |
Weekly review | Weekly | Win rate, average R, drawdown |
Strategy audit | Monthly | Sharpe ratio, max drawdown, edge decay |
For how to backtest a portfolio, the process involves running your rules against historical data to see how they would have performed. This validates your logic before you risk real capital and helps identify weaknesses in your approach.
“Systematic rules over discretion eliminate biases and support data-driven adjustments through daily tracking of P&L, correlations, and heat.”
Steps for iterative improvement:
Track daily P&L, heat, and correlations using your analytics tool
Run weekly reviews comparing actual vs. expected performance
Use innovative tracking methods to surface patterns in your trading behavior
Backtest any proposed rule changes before applying them live
Document every adjustment and its rationale for future reference
A smarter path: Move beyond intuition and embrace data-driven discipline
Most traders overestimate the value of their instincts and underestimate the cost of acting on them. Experience in markets does build pattern recognition, but without a systematic framework to test and validate those patterns, intuition becomes a liability rather than an asset.
The traders who consistently outperform are not necessarily smarter. They are more disciplined. They follow rule-based trading approaches that define every decision in advance and measure every outcome objectively. They do not let a strong conviction override their position sizing rules. They do not abandon their rebalancing process because a sector looks promising.
What separates good portfolio managers from great ones is not market knowledge. It is the willingness to submit every decision to a verifiable process. When you build a system, track it honestly, and refine it based on data rather than feeling, you create an edge that compounds over time. Intuition has a place in generating ideas, but discipline and verification are what turn those ideas into repeatable results.
Ready to elevate your portfolio management?
Building a disciplined, data-driven portfolio management process takes the right framework and the right tools. Whether you are refining your risk controls or looking for smarter ways to track and verify your strategy, having structured support makes the process faster and more reliable.
Nvestiqoffers traders a platform built to translate real trading intuition into quantifiable, systematic strategies. From actionable portfolio management resources to guided frameworks that help you build and verify your edge, Nvestiq gives you the infrastructure to manage your portfolio with confidence. Explore the platform and take the next step toward a more disciplined, results-driven approach to trading.
Frequently asked questions
What is the ideal number of holdings in a diversified trading portfolio?
Holding 15 to 20 securities across at least five sectors and three regions can reduce unsystematic risk to under 5%, giving your portfolio a structurally sound base.
How much risk should I take on a single trade?
Limit risk to 1 to 2% per trade of your total portfolio value, and keep overall portfolio heat capped between 30 and 50% to avoid catastrophic drawdowns.
Is frequent rebalancing necessary for portfolio management?
Not always. Frequent rebalancing costs the industry around $16 billion annually and can reduce returns in trending markets; conditional or forecast-based rebalancing is often more effective.
How do I track and improve my portfolio management process?
Track daily P&L, correlations, and heat, then use backtesting to validate rule changes. Systematic tracking over discretion eliminates bias and supports objective, data-driven improvement.