
Blogs
How to Select Technical Indicators: Building a Solid Foundation
Nick Garidzhuk
When many new traders first open a trading platform and see all the lines, numbers, and colorful patterns, they feel lost. It’s easy to assume there must be a "magic" indicator setup that guarantees profits. With experience, though, it becomes clear: there is no secret recipe to always win.
What does exist are solid, repeatable methods for building a strong technical foundation—whether someone trades stocks, forex, options, or crypto.
This beginner-friendly guide explains essential technical indicators, why they matter, and how traders commonly use them in practice. It also highlights common beginner traps so new traders can avoid them.
Why Technical Indicators Matter
Technical indicators help traders make sense of chaotic price movements. They take raw price and volume data and convert it into charts and signals that are easier to interpret.
Used well, indicators can help a trader:
Spot trends
Gauge momentum
Identify potential reversal points
Find support and resistance zones
Think of indicators as tools in a trading toolbox. A few well-chosen tools, used correctly, can increase clarity and confidence. Too many tools, used without a plan, often just clutter the screen and create confusion.
Most beginners don’t need dozens of indicators. A small set of core indicators, understood deeply, is usually a far more effective starting point.
The Five Essential Indicators for Beginners
Before experimenting with advanced setups, many traders build their foundation with five widely used tools. These can be applied to short-term day trades or longer-term swing and position trades.
Candlestick Charts: Understanding Price Action
Line charts show where price has been, but they often hide important detail. Candlestick charts offer much more information per bar.
Key information each candlestick provides:
Open, High, Low, Close (OHLC): Where price started, how far it moved, and where it ended for that period.
Market sentiment: Long wicks or specific shapes (like hammers or shooting stars) can hint at potential shifts in buying or selling pressure.
Patterns: Repeating forms such as engulfing candles, dojis, or other patterns can suggest trend continuation or reversal.
Practical tip:
New traders should switch their charts to “candlestick” mode and simply observe. Watching how different candle shapes appear before strong moves helps build an intuitive sense of price action over time.
Volume: Gauging Interest and Liquidity
Volume measures how many shares/contracts are traded in a given time. It shows how active a market really is.
Why volume matters:
High volume: Often signals strong interest and commitment. Breakouts with high volume tend to be more reliable.
Low volume: Can indicate weak participation. Price moves may be more easily manipulated and less trustworthy, and getting in or out of a position can be harder.
Practical tip:
On most platforms, volume bars are shown under the price chart.
A large green candle on low volume is less convincing.
A strong move backed by high volume is usually more meaningful.
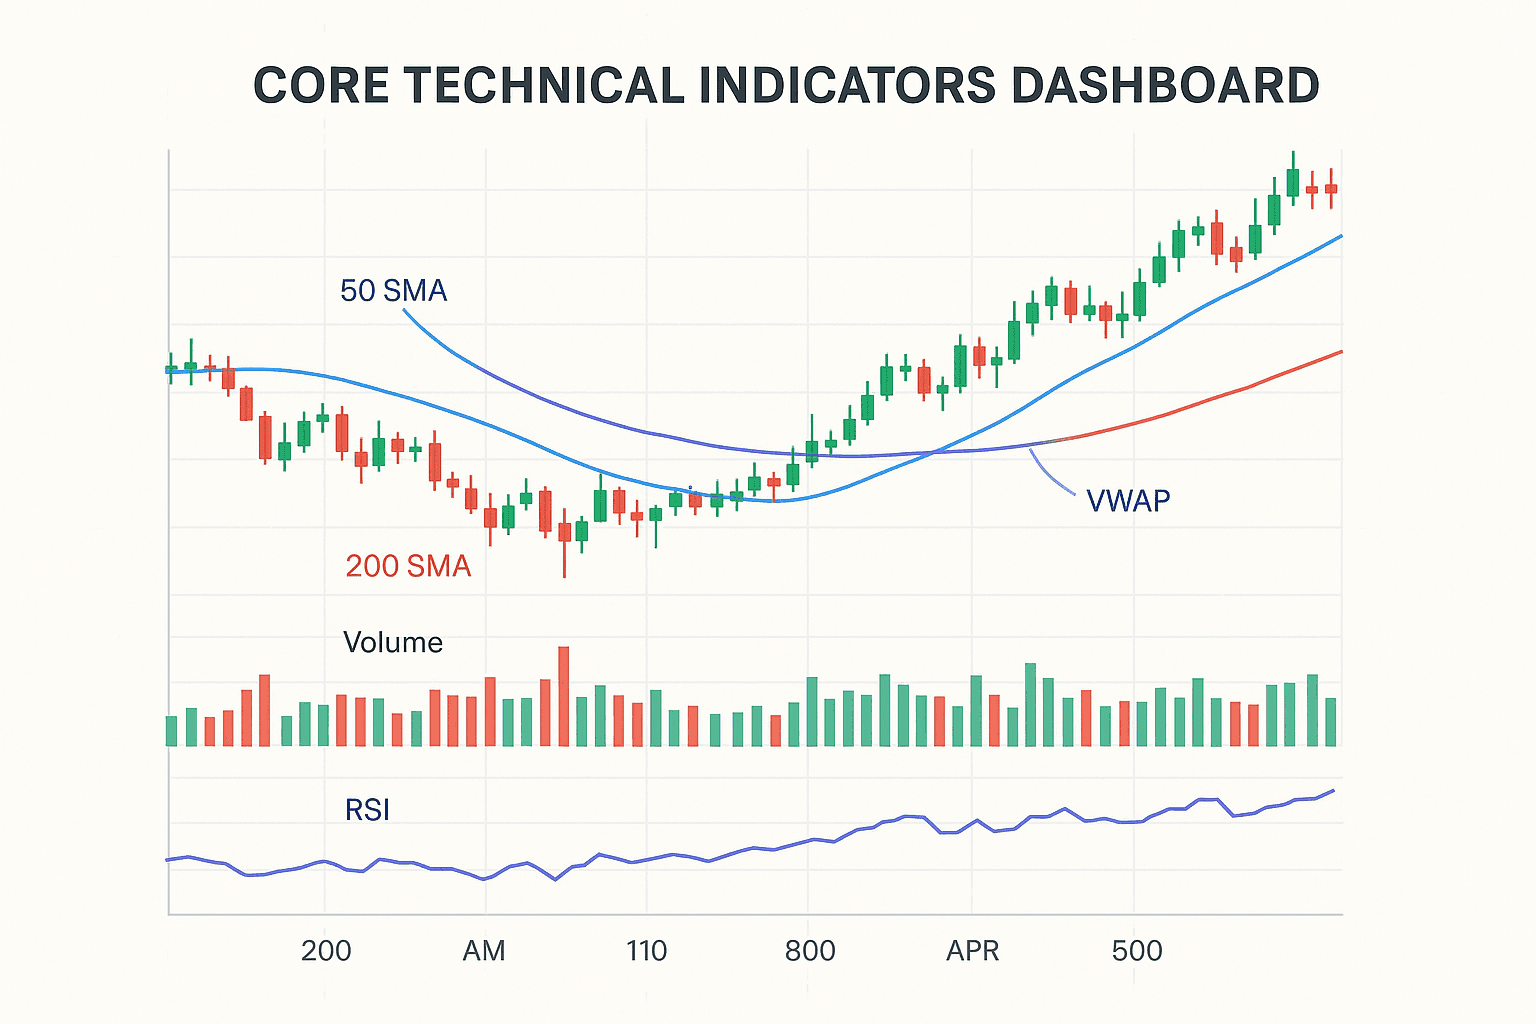
Moving Averages: Identifying Trends and Key Levels
Moving averages smooth out noisy price data and help reveal the underlying trend.
Two common types:
Simple Moving Average (SMA): Average closing price over a set number of periods.
Exponential Moving Average (EMA): Similar to SMA, but gives more weight to recent price, so it reacts faster.
Useful starting periods:
50-Period SMA: Often used to gauge medium-term trends and can act as dynamic support or resistance.
200-Period SMA: A popular long-term trend indicator. Price above this line is often viewed as bullish; below it, more cautious.
8 or 9 EMA: A fast-moving average used for short-term signals and trade management.
Practical example:
Many traders consider it bullish when price breaks above the 50 SMA on strong volume. If price later pulls back to the 50 SMA and bounces with renewed volume, some traders treat that as a potential entry point.
VWAP (Volume-Weighted Average Price): The Intraday Compass
VWAP is widely used for intraday trading. It combines price and volume to show the average price paid throughout the trading session.
Common interpretations:
Price above VWAP: Buyers are generally in control; many traders favor long setups.
Price below VWAP: Sellers are more dominant; traders may look for short setups or avoid longs.
Large institutions often watch VWAP, and it frequently acts as a dynamic support or resistance level during the day.
Practical tip:
Intraday traders often avoid going long when price is significantly below VWAP. If price regains VWAP with strong volume, they may start looking for long opportunities.
Oscillators & Confirmatory Indicators: MACD, RSI, and Stochastic
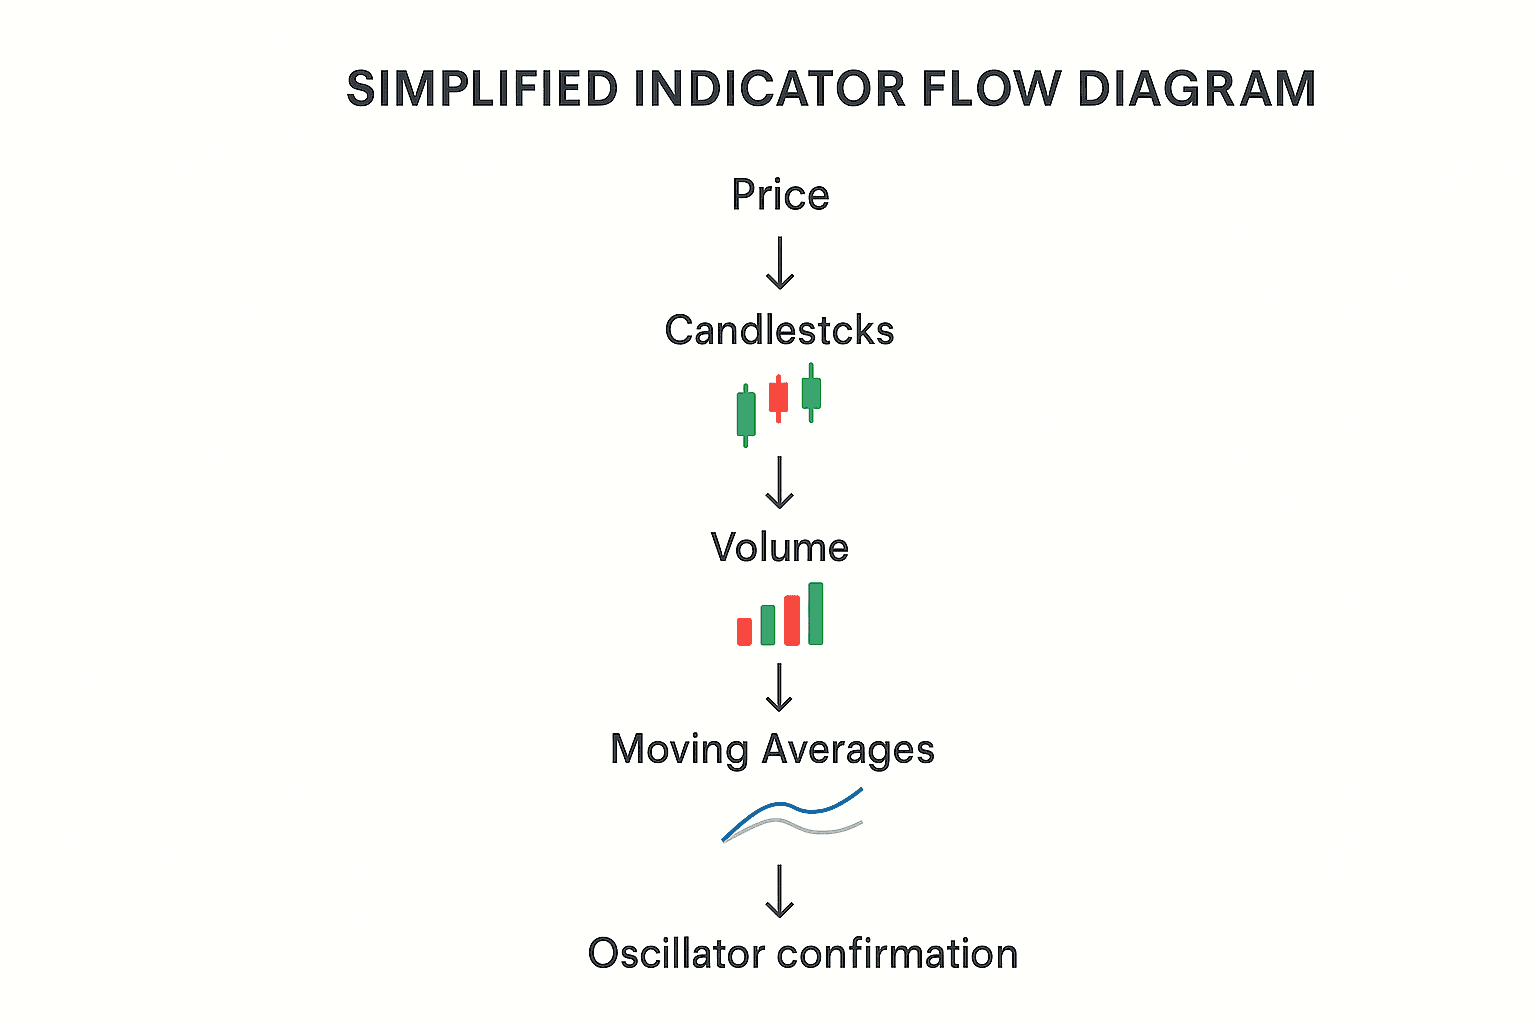
Once price, volume, and moving averages are understood, oscillators can act as confirmation tools rather than primary signals.
Common oscillators:
MACD (Moving Average Convergence Divergence):
Highlights momentum shifts.
Bullish signals can appear when the MACD line crosses above its signal line.
RSI (Relative Strength Index):
Measures the speed and magnitude of recent price changes.
Values above ~70 often suggest “overbought” conditions; below ~30, “oversold.”
Stochastic Oscillator:
Similar to RSI in purpose; helps identify stretched moves and potential turning points.
These indicators are most useful as an additional layer—helping confirm what price and volume already suggest.
Example setup:
Imagine price is:
Above the 50 and 200 SMA
Holding above VWAP
And an oscillator like RSI is pulling up from oversold territory or MACD has just crossed bullish
That combination of factors can give traders more confidence in a potential long entry.
Practical Guide: How to Apply These Indicators
The goal is not to stack on as many indicators as possible. A clean, focused chart makes decision-making faster and clearer.
A simple starting layout might be:
Switch the chart type to candlesticks.
Add volume bars below the chart.
Plot the 50 SMA, 200 SMA, and one fast EMA (such as 8 or 9).
Add VWAP for intraday trading.
Choose one oscillator (MACD or RSI) as a confirmatory tool.
Spend time watching how these tools behave in uptrends, downtrends, ranges, and breakouts.
Strategy Design and Testing: Where Many Beginners Get Stuck
Designing and testing strategies based on these indicators can be challenging. Many platforms require coding skills to:
Turn indicator rules into algorithms
Backtest ideas over historical data
Automate trades based on signals
For beginners who just want to describe their strategy in plain language, this is often a major barrier.
This is where tools like Nvestiq can help. Nvestiq allows traders to:
Describe their strategy in natural language (e.g., “Buy when price is above the 50 SMA and VWAP, and RSI crosses above 30”)
Have AI automatically build and test the trading algorithm
Skip the need for programming knowledge
This lets traders focus on refining logic and understanding their indicators, while the platform handles the technical implementation and backtesting.
Example: Day Trading a Stock Using the Core Indicators
Consider a common intraday scenario:
A stock gaps up at the open.
On the 5-minute chart:
Several strong green candlesticks appear with small wicks.
Volume spikes on the breakout.
Price trades above both the 50 SMA and VWAP.
The 8 EMA closely tracks price as a moving support.
RSI rises but stays below the overbought zone (70).
MACD lines trend upward and diverge.
A typical approach in this situation might be:
Wait for the initial surge to cool off.
Look for a pullback toward the 8 EMA or VWAP.
If a new green candle forms there on increasing volume, consider an entry.
Stay in the trade as long as price holds above the fast EMA and VWAP.
If price decisively breaks below these levels, consider exiting.
This kind of structured plan uses indicators as guides—not guarantees—to manage risk and opportunity.
Avoiding the “Holy Grail” Trap
A common beginner mistake is believing that more indicators will produce better results. Many traders overload their charts with six, eight, or even ten indicators, hoping for a perfect “buy/sell” signal. This usually leads to analysis paralysis.
What tends to work better:
Tips for success:
Less is more:
Focus on a small set—like the five covered here—and learn them deeply.Fit indicators to lifestyle:
Someone with a full-time job may prefer higher timeframes (e.g., 4-hour, daily charts) and longer moving averages to reduce the need for constant screen time.Keep a trading journal:
After each trade, record:Which indicators were used
The setup
The outcome
Over time, patterns emerge, and traders can refine or remove indicators based on real results.
Practice in a demo account first:
Paper trading or using a demo account allows traders to test strategies and indicator combinations without risking real money.
Tailoring the Toolkit Over Time
These five indicators form a strong baseline, but every trader eventually customizes their toolkit.
Some advanced traders rely almost entirely on price and volume.
Others add tools like Bollinger Bands, channels, or Fibonacci levels on top of the basics.
The key is gradual refinement:
Start simple.
Understand what each indicator measures and how it behaves.
Add or remove tools deliberately based on experience and results.
Final Thoughts: Clarity Beats Complexity
Choosing initial technical indicators is like laying the foundation of a house. It doesn’t need to be flashy; it needs to be solid.
A focus on:
Clear candlestick charts
Volume
A few moving averages
VWAP (for intraday)
One oscillator for confirmation
…often takes traders much further than chasing secret formulas or complex “indicator stacks.”
Trading will always require discipline, learning, and emotional control. But starting with a simple, well-structured indicator setup gives traders a clear framework to make better decisions and pursue more consistent results.
From here, the next step for any trader is straightforward:
Open the charts.
Set up these core tools.
Observe how they interact in different market conditions.
Keep learning, testing, and refining.
The market tends to reward those who stay patient, keep things simple, and continuously build their understanding over time.