
Blogs
How to Use Economic Indicators in Trading — A Complete Guide for 2025
Nick Garidzhuk
Introduction
In 2025, traders operate in a world where both global macro data and high-frequency signals matter. This guide explains how traders use economic indicators as part of their strategy toolkit — not as standalone signals, but as structured inputs to trading decisions. It covers what economic indicators are, how they affect markets, how to interpret them across regions (the US, Europe, and Asia), and how to build a workflow that uses them effectively.
What Are Economic Indicators?
Economic indicators are measurable statistics issued by governments, international organizations, or private institutions that show how well an economy is performing.
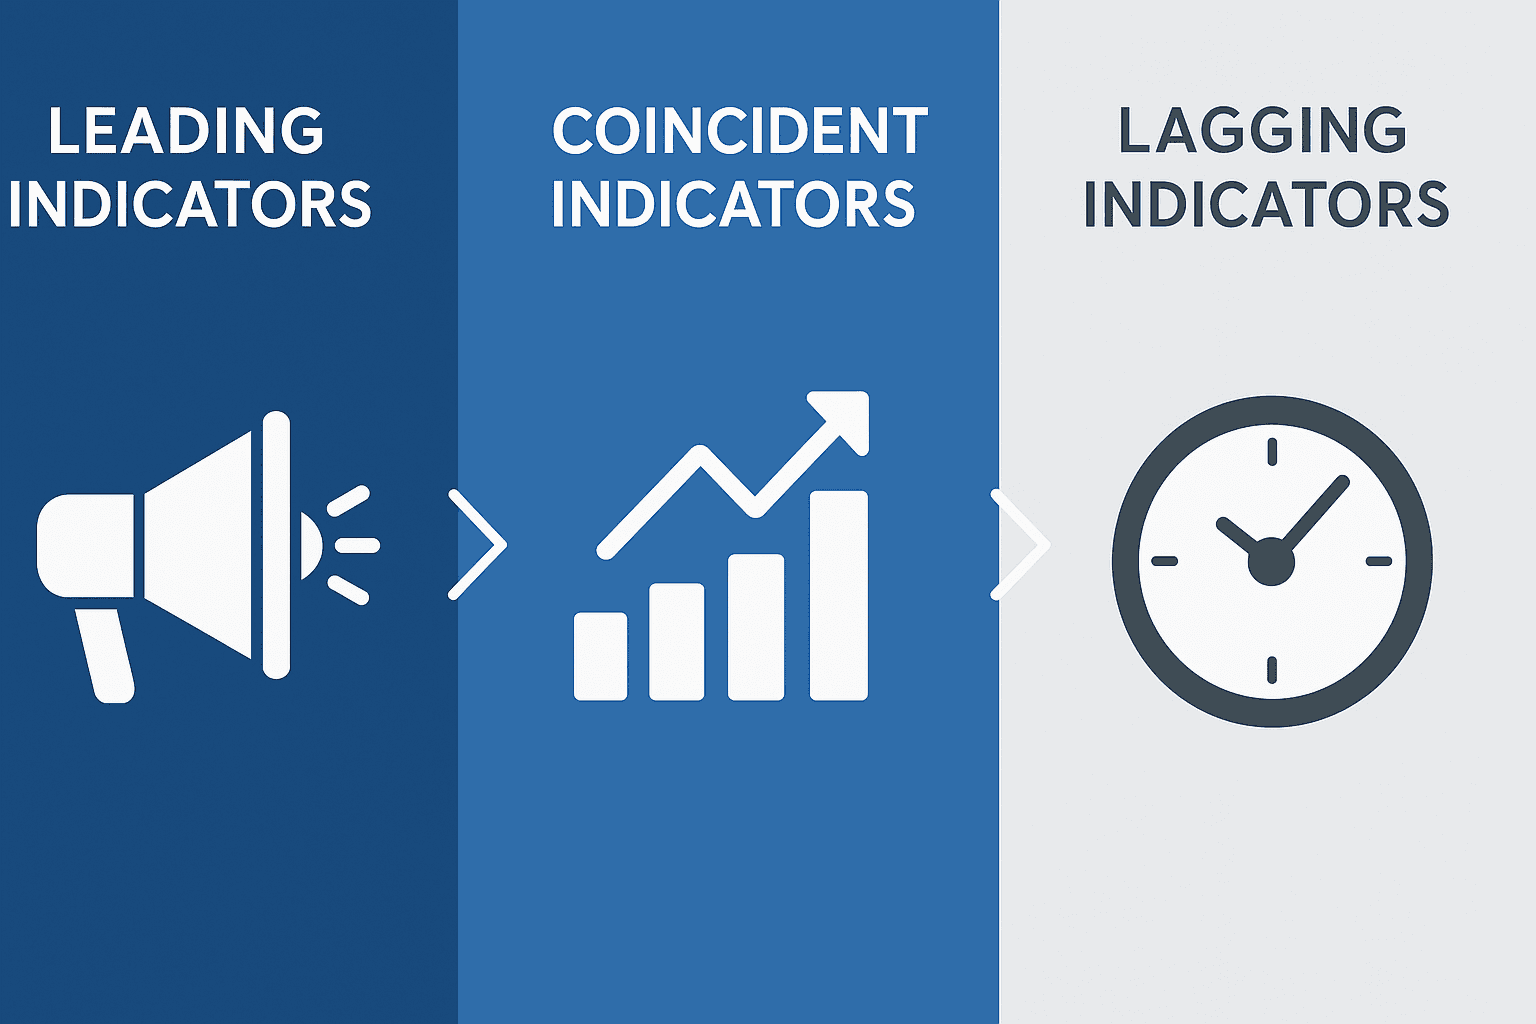
They can be categorized into:
Leading indicators: Predict future economic movements (e.g., building permits, consumer sentiment).
Coincident indicators: Reflect current economic conditions (e.g., industrial production, employment levels).
Lagging indicators: Confirm established trends (e.g., unemployment rate, consumer debt).
For traders, indicators act as a lens to anticipate market trends, gauge sentiment, and identify turning points in stocks, currencies, commodities, or bonds.
Why Economic Indicators Matter in Trading
Market Direction: Economic indicators help traders anticipate whether markets are likely to rise or fall ahead of corporate or macro events.
Risk Positioning: Traders can reduce exposure before weak data releases or increase it when strong data suggests confidence.
Currency and Flow Impact: Data like GDP and inflation influence currency strength and global capital flows.
Context for Technical Analysis: Economic data provides a fundamental backdrop that supports or contradicts chart-based strategies.
Key Economic Indicators Traders Should Track (2025 Edition)
Indicator | Region | Frequency | How Traders Use It |
|---|---|---|---|
Gross Domestic Product (GDP) | Global | Quarterly | Measures total economic growth; higher GDP usually signals expansion, lower GDP signals slowdown. |
Consumer Price Index (CPI) / Inflation | Global | Monthly | Tracks price changes; influences central bank interest-rate policy and market yields. |
Unemployment / Non-Farm Payrolls (NFP) | US and global | Monthly | Indicates labor market strength; strong reports may lift currencies or yields. |
Retail Sales / Consumer Spending | Global | Monthly | Reflects consumer confidence and overall demand; impacts retail and service sectors. |
Purchasing Managers’ Index (PMI) | Global | Monthly | Measures manufacturing and service sector activity; useful for predicting growth trends. |
Interest Rate Decisions / Central Bank Minutes | Global | Scheduled throughout the year | Central bank policy changes affect bonds, currencies, and equity valuations. |
How to Interpret Economic Indicator Releases for Trading
Compare Actual vs. Consensus: Markets move when data differs from expectations. Surprises can trigger volatility.
Follow the Trend: A single data point is less important than whether it confirms or reverses a larger trend.
Understand Context: Inflation may be high, but if wages are stagnant, it might not signal overheating.
Observe Market Reaction: Sometimes “good” data can lead to negative market moves (e.g., strong inflation leading to rate hikes).
Consider Global Spillovers: A major surprise in the US, China, or Europe can shift currencies and commodities worldwide.
Use Risk Controls: Data releases often cause large price swings, so stops and position limits are essential.
Building a Trading Workflow Around Economic Indicators
Step 1: Set up an economic calendar and mark key releases (GDP, CPI, NFP, PMI).
Step 2: Adjust exposure before big announcements based on likely scenarios.
Step 3: Monitor live results and how markets react immediately.
Step 4: Evaluate whether the release changes the overall trend or short-term momentum.
Step 5: Enter trades aligned with your thesis (e.g., long USD if inflation is high).
Step 6: Apply strict risk management—set stop losses, define exit rules, and track performance.
Step 7: Review outcomes weekly to refine your understanding of which indicators influence your markets most.
Regional and Geographic Considerations
United States: US data like CPI, NFP, and Federal Reserve decisions often have global influence since the dollar is a reserve currency.
Europe: Watch Eurozone PMI, inflation, and ECB rate decisions, as these heavily impact the euro and European equities.
Asia: Chinese manufacturing data, Indian inflation, and export numbers from Japan or South Korea can move Asian and global markets.
Commodities and Currencies: Economic reports from countries like Canada (oil) or Australia (metals) affect commodity-linked currencies.
Each region’s economic cycle offers different opportunities — aligning your strategy with the dominant data source for that region is key.
Example Trade Scenario
Event: The US CPI report shows inflation much higher than expected.
Interpretation: Strong inflation could push the Federal Reserve toward tighter policy.
Market Reaction: Bond yields rise, stocks (especially tech) might fall, and the US dollar strengthens.
Possible Trades:
Short growth-heavy equity ETFs.
Long USD/JPY or USD/EUR pairs.
Long gold or commodity assets if inflation expectations remain high.
Risk Control: Use stop losses and monitor follow-up reports like wage growth and PPI to confirm the trend.
Limitations and Cautions
Economic indicators are lagging or revised, so short-term reactions can reverse quickly.
Markets often price in expectations before the release.
Political events, natural disasters, or policy shocks can override data.
Over-trading based solely on indicators without broader context increases risk.
Economic indicators should complement — not replace — technical, sentiment, or risk-based analysis.
Conclusion
Using economic indicators in trading provides structure and insight into market direction. In 2025, data-driven trading is about connecting macro trends to tactical execution — not guessing.
By following key indicators like GDP, inflation, unemployment, and PMI across major regions, traders can better understand market cycles, anticipate central bank policy moves, and align trades with economic reality.
When combined with strong risk management and consistent review, economic indicators can transform raw data into actionable trading decisions — helping traders make informed, disciplined choices across global markets.