Blogs
QQQ vs QQQM: The Real Differences for Traders in 2026
Aman Anand
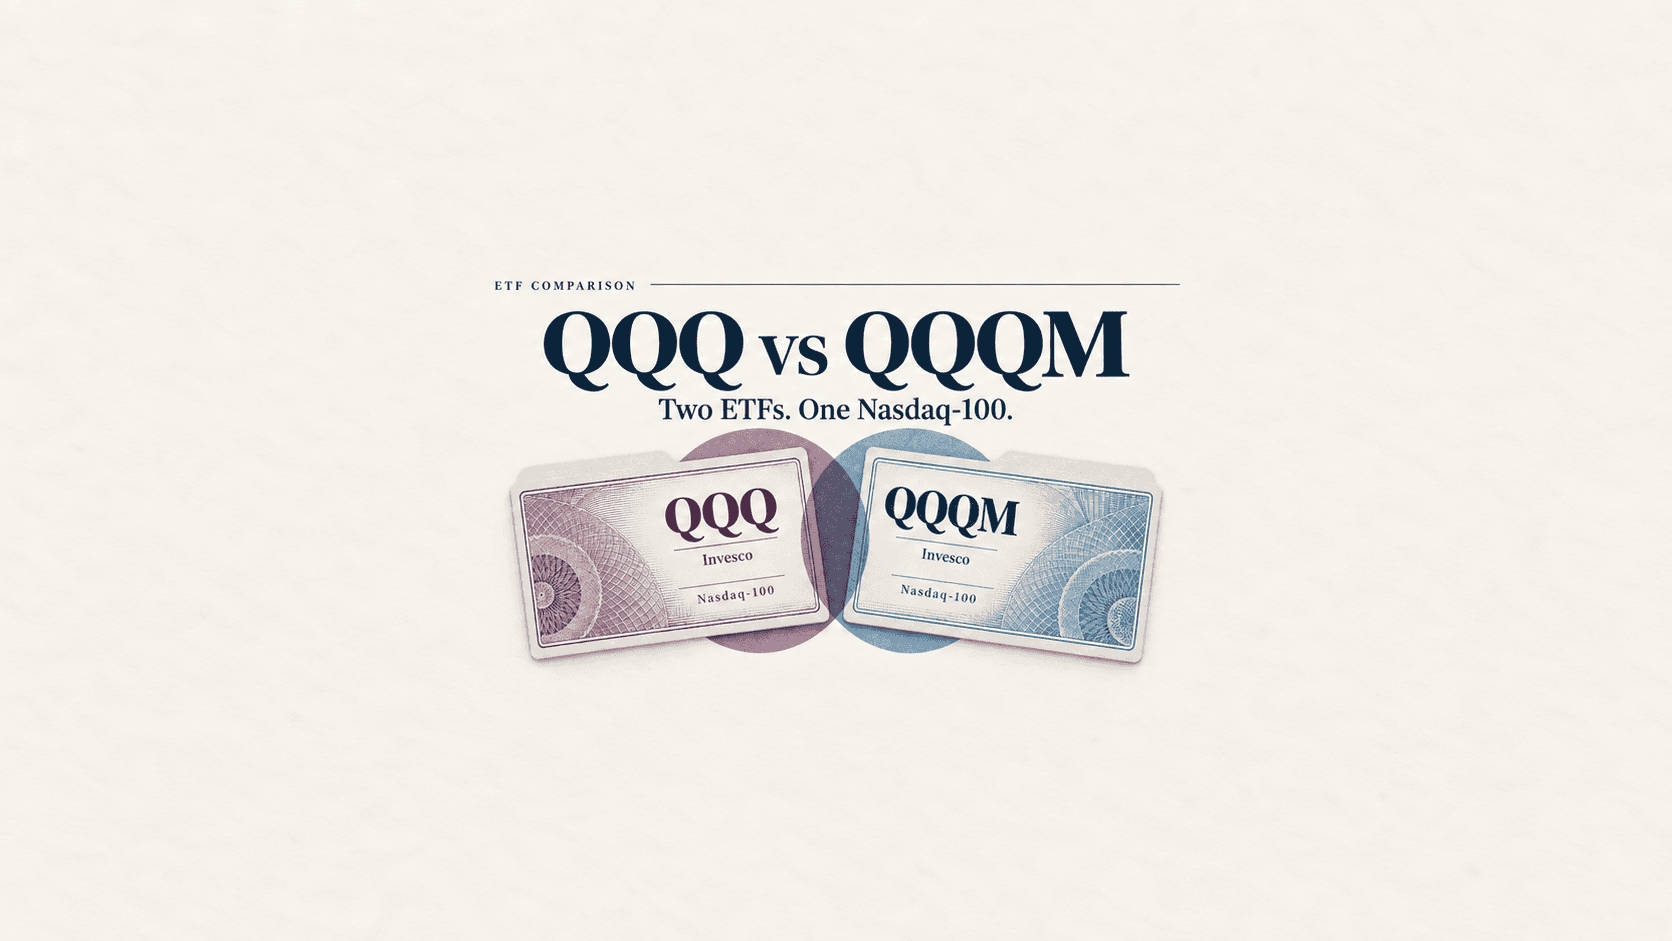
QQQ and QQQM are the same fund in two wrappers. Both are run by Invesco, both track the Nasdaq-100, both hold the same roughly 100 stocks at the same weights. Invesco launched QQQM in October 2020 for exactly one reason: QQQ's fee was losing long-term holders to cheaper rivals, so they built a 0.15% version and left QQQ alone for the traders who did not care about a few basis points.
That is the whole product story. What it leaves out, and what matters if you run a systematic strategy, is that QQQ trades many times QQQM's dollar volume, has a share price more than twice as high, and has 21 more years of price history. Each of those changes how you should use it in a backtest and in production.
Key Takeaways
Point | Details |
|---|---|
Same holdings, same returns | Both track the Nasdaq-100. Year-to-date and multi-year returns match to within a few basis points. Drawdowns are identical. |
QQQM is cheaper | 0.15% against 0.18%. On $100,000 that is $150 a year against $180. |
QQQ is far more liquid | QQQ trades many times QQQM's daily dollar volume. |
QQQM has no history before late 2020 | It never traded through 2008, 2018 or the March 2020 crash. Backtests on QQQM alone are untested against a real bear market. |
Share prices differ by more than 2x | QQQ trades above $700, QQQM around $300. That affects how finely you can size a position without fractional shares. |
QQQ vs QQQM at a Glance
Metric | QQQ | QQQM |
|---|---|---|
Full name | Invesco QQQ Trust | Invesco NASDAQ 100 ETF |
Index tracked | Nasdaq-100 | Nasdaq-100 |
Holdings | About 100 | About 100, identical |
Expense ratio | 0.18% | 0.15% |
Inception | March 1999 | October 2020 |
Legal structure | Open-end ETF (converted from a unit investment trust in December 2025) | Open-end ETF |
Share price (mid 2026) | Above $700 | Around $300 |
Figures reflect issuer and exchange data as of mid 2026 and are rounded.
Why QQQM Exists
By 2020, QQQ was one of the largest ETFs in the world and also one of the more expensive index trackers, at 0.20% at the time. Vanguard and iShares were charging 0.03% to 0.10% for comparable exposure. Invesco faced a choice: cut QQQ's fee and give up revenue on hundreds of billions in assets, or launch a cheaper twin and let holders self-select.
They chose the twin. QQQM launched in October 2020 at 0.15%, built as an open-end ETF rather than a unit investment trust, which also let it reinvest dividends and lend securities the way QQQ structurally could not at the time. QQQ's fee came down to 0.18% when it converted to an open-end ETF in December 2025, but the gap remains.
The result is two funds with the same index, the same manager and the same holdings, where the only real differences are cost, liquidity and age.
Liquidity: The Depth Gap
QQQ trades many times QQQM's dollar volume on an average day. For a retail account trading a few thousand dollars at a time, both are effectively infinitely liquid. For a strategy trading size, or trading during volatile sessions, the difference is material.
Interestingly, QQQM's average quoted spread, measured in basis points, is slightly tighter than QQQ's. That sounds backwards until you look at share price: QQQM trades near $300 and QQQ above $700, so a one-cent spread is a smaller percentage of QQQM's price. In dollar terms the spreads are similar. In depth, QQQ is in a different league.
Where QQQ's depth matters most is at the open, at the close, and during sharp intraday moves, when QQQM's book can thin out and market orders start paying more than the quoted spread suggests. If your strategy trades those windows, QQQ is the safer instrument.
The Backtest Problem With QQQM
This is the section most QQQ vs QQQM comparisons skip, and it is the most important one for anyone building a system.
QQQM has price data from October 2020 onward. That window includes the 2021 rally, the 2022 bear market and the AI-driven run since. It does not include the March 2020 crash, the Q4 2018 selloff, 2008, or the dot-com collapse that took the Nasdaq-100 down roughly 80%. A strategy backtested on QQQM alone has been tested through exactly one bear market.
QQQ has data from March 1999. That covers every regime the Nasdaq-100 has produced, including the one where it fell for three consecutive years.
The right approach is straightforward: backtest on QQQ for the full history, then confirm on QQQM for the overlapping period. Because they hold the same stocks, QQQ is a near-perfect proxy for how QQQM would have behaved. The confirmation step just checks that nothing about QQQM's structure or spread changes the result, and it will not. But the history step is not optional. A Nasdaq-100 strategy that has not been run through 2000 to 2002 has not been stress-tested.
Three further details:
Use total return data. Both distribute quarterly. Price-only backtests understate long-only returns by the yield each year.
Model the spread properly. Both are liquid enough that a flat one-cent assumption is reasonable at retail size, but a percentage-based model will slightly favor QQQM because of its lower share price. That is an artifact, not an edge.
Stops calibrated on one transfer to the other. Beta, volatility and drawdown profiles are identical, so position sizing and risk parameters carry over without adjustment.
For the general framework on validating across regimes, see our effective backtesting guide.
Share Price and Position Sizing
QQQ trades above $700 a share. QQQM trades around $300. If your broker supports fractional shares, this is irrelevant. If it does not, or if your execution system works in whole shares, QQQM lets you size positions more precisely. On a $10,000 allocation, QQQ rounds to 14 shares and leaves nearly $200 uninvested. QQQM rounds to 33 shares and leaves under $100.
For most strategies this is noise. For a system that rebalances frequently across several instruments and needs tight dollar-weighting, it adds up.
Which One to Use
Use QQQ when you trade intraday, trade the open or close, trade size that is a meaningful fraction of QQQM's volume, or need pre-market and after-hours liquidity. Also use QQQ for any backtest that needs history before October 2020, which is every backtest that should be taken seriously.
Use QQQM when your holding period is weeks or longer, you want the lower fee compounding for you, and you would benefit from finer position sizing. This describes most retail trend and momentum strategies on the Nasdaq-100.
The split that makes sense: test on QQQ, deploy on QQQM. You get 27 years of regime coverage in validation and the cheaper wrapper in production.
Where Nvestiq Fits
The QQQ-then-QQQM workflow is exactly the kind of thing that should take two minutes and usually takes an afternoon: run the strategy on the long history, then re-run on the short one and confirm the overlapping period matches. In a spreadsheet or a notebook, that means re-aligning dates, re-fetching data and re-running the logic twice.
Nvestiq lets you describe the strategy once in plain English, compiles it to exact logic, and backtests it against any ticker and window, with a report that shows returns, holding costs and a buy-and-hold comparison. Switching from QQQ to QQQM is a one-word change, so you can compare the results directly. If the 2000 to 2002 window on QQQ produces a drawdown you have never seen on QQQM, that is the finding that saves your account.
Frequently Asked Questions
Is QQQM better than QQQ?
For a long-term holder, yes, on cost alone. It is the same fund at 0.15% instead of 0.18%. For an active trader, QQQ is better because of its far deeper liquidity. Neither is better on performance because they hold identical portfolios.
Do QQQ and QQQM have the same holdings?
Yes. Both track the Nasdaq-100 with full replication, so they hold the same roughly 100 stocks at the same weights. Returns match to within a few basis points, and the small gap is the fee difference.
Can I backtest QQQM through the 2008 crash or the dot-com bust?
No. QQQM launched in October 2020. For any period before that, use QQQ, which has continuous data from March 1999. Since they hold the same index, QQQ is a near-perfect proxy.
Why does QQQM have a tighter spread than QQQ?
Mostly because its share price is less than half of QQQ's, so a one-cent spread is a smaller percentage. In dollar terms the spreads are similar. QQQ has vastly more depth behind the quote, which matters more than the quoted spread when trading size or during volatile sessions.
Should I switch from QQQ to QQQM?
If you are a buy-and-hold investor, the fee savings are real, though small, and switching makes sense subject to any tax on the sale. If you trade actively, stay in QQQ. The liquidity is worth more than three basis points.
Risk Disclosure
Trading involves substantial risk of loss and is not suitable for all investors. Past performance does not guarantee future results. Algorithmic trading strategies carry unique risks including system failures and market volatility. Nvestiq provides technology tools, not financial advice. You should consult a qualified financial advisor before making any investment decisions.